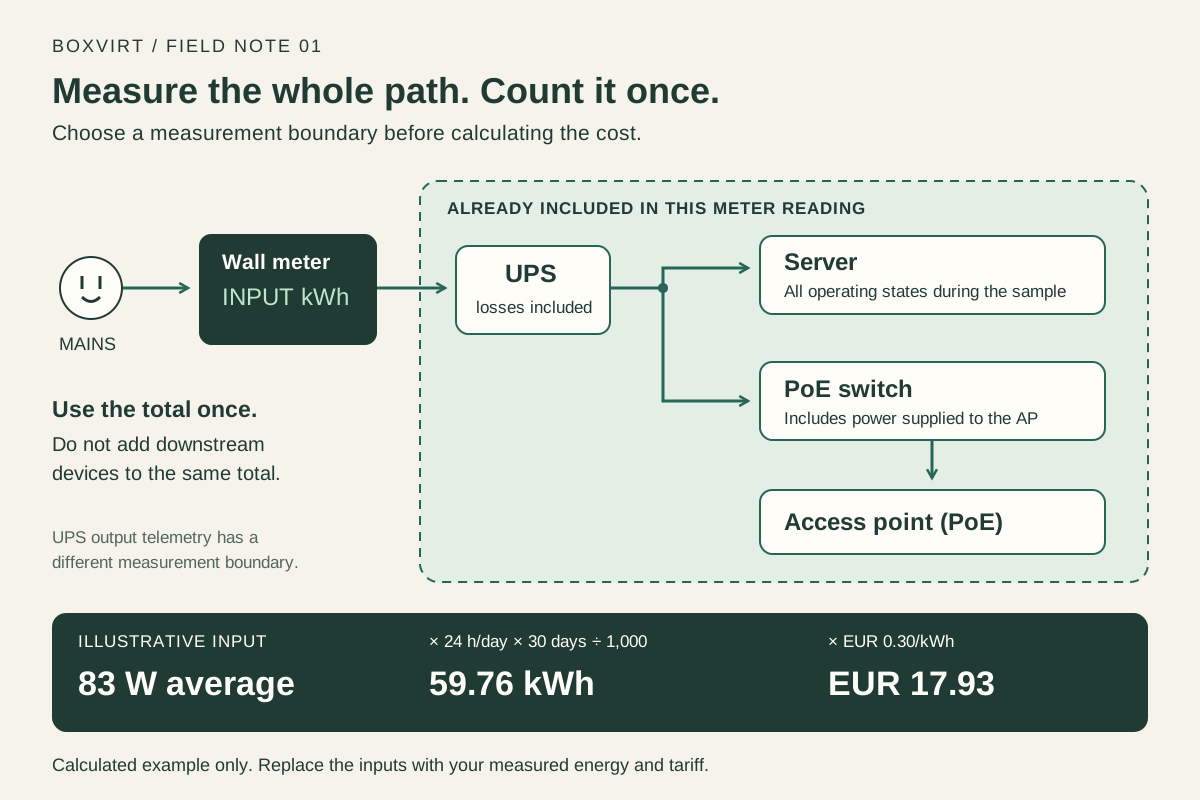
A homelab averaging 83 watts around the clock uses 59.76 kWh in 30 days. At an example rate of EUR 0.30 per kWh, its energy charge is EUR 17.93. To calculate your own cost, you need the average power of the equipment you want to include, its operating time, and the rate on your electricity tariff.
The tricky part is getting that average. A server’s idle reading misses its busy periods, and adding individual devices to a whole-rack measurement counts their consumption twice. Start by deciding exactly what your meter includes.
All figures in the worked examples below are invented inputs for explaining the method. They are not measurements of Boxvirt’s systems or typical ratings for a particular server.
The calculation: average watts to energy cost
For a constant load, or a measured average over the full operating period:
Energy (kWh) = average power (W) × operating hours ÷ 1,000
Energy charge = energy (kWh) × price per kWh
Watts describe power; kilowatt-hours describe energy accumulated over time. The EIA’s explanation of electricity measurement sets out that distinction. Your tariff supplies the price; the wattage alone cannot tell you the cost.
You can enter your figures in the electricity cost calculator. For an always-on lab, use its measured average watts and 24 hours per day. The sections below explain how to obtain a useful input.
Choose one measurement boundary
Suppose a plug-in energy meter sits between the wall outlet and your UPS. The UPS powers a server and a PoE switch, and the switch powers an access point. That upstream reading includes the whole path: UPS input, server, switch and AP. Enter it as one total. Adding a second row for the AP would count it again.
Alternatively, measure devices individually and add their separate energy use. Keep a small inventory recording what each reading covers. If a switch’s wall measurement includes its PoE devices, label the row accordingly.
A UPS display needs more care: check whether the figure describes input
power or output load. Output load does not include the UPS’s own conversion
losses. Eaton defines efficiency as output power divided by input power.
For a documented operating efficiency, the corresponding estimate is
input W = output W ÷ efficiency, with efficiency expressed as a fraction.
Use information applicable to that model and load; a single assumed percentage
is a weak substitute for an upstream measurement. Battery charging also changes
the input reading, so record whether it occurred during your sample.
Use accumulated kWh to find average watts
An instantaneous reading is useful for spotting a change. Accumulated energy over a known interval captures the changing workload during that interval.
Record the meter’s starting kWh, ending kWh and elapsed time. Leave the usual services and scheduled jobs running. A useful first sample might cover a week, including the backup or storage maintenance jobs that normally occur during it. If an important job runs less often, account for it separately or measure longer.
Here is the hypothetical sample used in this article:
| Item | Example input or result |
|---|---|
| Measurement point | Wall input of the UPS, covering all downstream equipment |
| Energy used during the interval | 13.944 kWh |
| Elapsed time | 168 hours, exactly seven days |
| Mean daily energy | 13.944 ÷ 7 = 1.992 kWh |
| Average power | 13.944 × 1,000 ÷ 168 = 83 W |
If your meter is cumulative, subtract the starting reading from the ending reading first. Avoid rounding the energy or average watts until the final result.
This sample is enough to demonstrate the calculation. Whether a real week represents your normal usage depends on what happened during it. A week with a large migration, a battery recharge or an unusually idle server needs that context recorded beside the number.
Enter the example in the calculator
In the Boxvirt electricity calculator, use one device row named “Lab measured at UPS input” and enter:
- Power: 83 W.
- Hours per day: 24; quantity: 1.
- Price per kWh: 0.30; currency: EUR.
- Days per month: 30.
The resulting estimates are:
| Period | Energy | Energy charge at EUR 0.30/kWh |
|---|---|---|
| One day | 1.992 kWh | EUR 0.60 |
| 30 days | 59.76 kWh | EUR 17.93 |
| 365 days | 727.08 kWh | EUR 218.12 |
The calculation uses unrounded values internally. For example, the daily charge is EUR 0.5976 before display rounding. Multiplying the displayed EUR 0.60 by 30 would give a different result.
Model idle and busy periods when you lack a long measurement
If you have separate power readings and a known schedule, calculate each operating state. Suppose one server draws an illustrative 52 W for 21 hours and 116 W for the remaining three hours:
Daily energy = (52 × 21 + 116 × 3) ÷ 1,000
             = 1.44 kWh
Average power across 24 hours = 1.44 × 1,000 ÷ 24 = 60 W
In the calculator, use two rows for that server: “idle” at 52 W for 21 hours, and “busy” at 116 W for three hours. Their periods cover one day without overlap. A third row for the same server at 60 W for 24 hours would duplicate the entire estimate. This is an alternative example, separate from the 83 W whole-lab measurement above.
Use a schedule estimate cautiously when power changes throughout a job. Accumulated kWh across a representative interval avoids having to describe every operating state yourself.
A processor’s TDP also needs context. Intel describes it as a processor design target used for thermal planning. It does not measure the complete host, including disks, networking, fans and power conversion. Likewise, a PSU’s rated capacity is not a measurement of what the server draws from the wall.
Match the tariff and the time period
Enter your own price per kWh. If the tariff says 30 cents per kWh, the calculator input is 0.30 in that currency. Choosing another currency changes the displayed label; it does not fetch an exchange rate or local price.
The calculator repeats the entered daily usage for the selected month length. It uses 365 days for the annual estimate. Twelve 30-day periods total 360 days, so multiplying the monthly result by 12 does not reproduce its annual figure. Choose the actual number of days when comparing against a calendar-month reading.
With time-of-use pricing, calculate energy in each price window separately and add the charges. A whole-day average can estimate total kWh while still misallocating consumption between expensive and cheap hours. This matters if most of a backup job occurs during one rate window.
The result estimates the energy charge for the equipment included in your inputs. Standing charges, demand charges, tiered pricing and other bill items need separate treatment. Check whether the rate you entered already includes applicable per-kWh taxes or charges before adding anything else.
Check a surprising result before changing the lab
Compare estimated and measured kWh over the same interval first. If those agree but the money differs, investigate the tariff and bill components. If the energy differs, revisit the measurement and operating schedule.
| Symptom | First check |
|---|---|
| The total is far above the upstream meter reading | Has a server, UPS output or PoE device been included twice? |
| A server seems to consume its PSU’s rated capacity continuously | Was a capacity label entered instead of average measured power? |
| A small change creates a huge estimated bill | Check W versus kW, and cents versus currency units per kWh |
| The estimate misses a regular peak | Does the sample include the relevant backup, scrub, transcode or charging period? |
| UPS telemetry and wall readings disagree | Compare measurement points, units, timestamps and battery state |
Keep your original reading as a baseline. When investigating consumption, change one thing at a time and compare equivalent workload periods. Document which services must remain available before considering a shutdown schedule; an inexpensive night can still be a problem if it interrupts the network or a backup job.
For a wider inventory, the Proxmox homelab planning guide helps identify compute, storage and networking dependencies. The backup and restore guide helps identify recovery tasks that belong in that operating plan.
Keep a record you can repeat
Save the measurement boundary, start and end timestamps, kWh difference, tariff, included devices and unusual workloads. That short record makes the next comparison useful: you can see whether consumption changed, the price changed, or the two measurements simply covered different equipment.
For the energy-and-cost arithmetic, see also the U.S. Department of Energy’s energy-use worksheet (PDF, page 15). The examples here use their own inputs and make no claim about current regional prices or measured hardware performance.